
In the main menu Server > Health > Server health dialog, a diagram of the last changes in the Server health level is displayed, as well as the conditions of the current health level and a list of previous levels from the event log.
Health > [current Server health level]
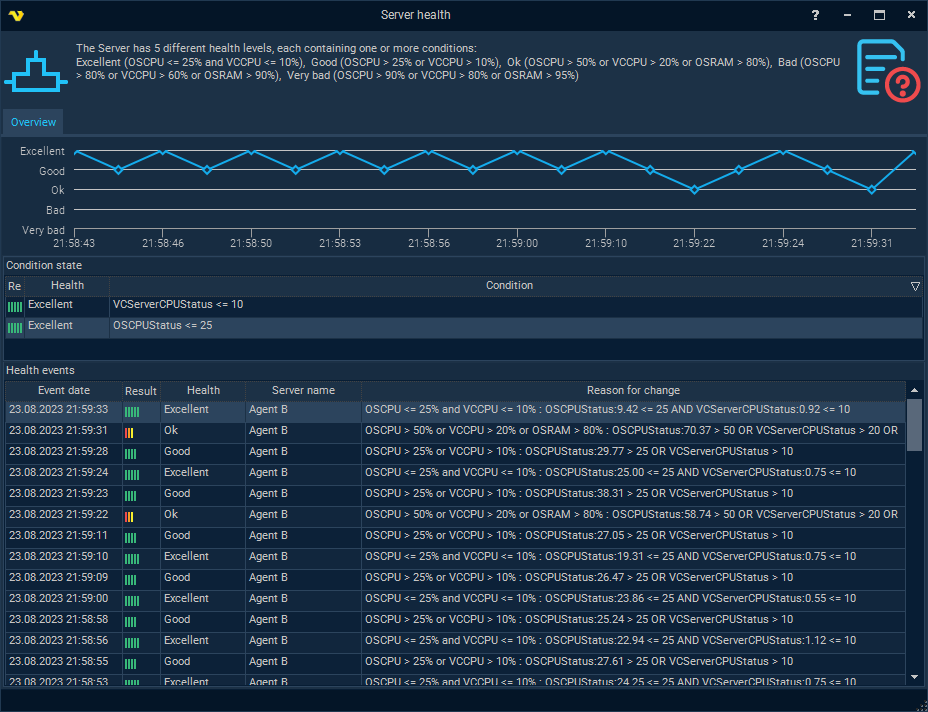
Server health levels*
* default health settings for version 10.0.2
Abbreviations:
•OSCPU - Total CPU consumption (%)
•VCCPU - CPU consumption by VisualCron Server (%)
•OSRAM - System memory in use (%)
Level |
Name |
Conditions |
|
Excellent |
OSCPU <= 25% and VCCPU <= 10% |
|
Good |
OSCPU > 25% or VCCPU > 10% |
|
Ok |
OSCPU > 50% or VCCPU > 20% or OSRAM > 80% |
|
Bad |
OSCPU > 80% or VCCPU > 60% or OSRAM > 90% |
|
Very bad |
OSCPU > 90% or VCCPU > 80% or OSRAM > 95% |


